Rat Complaints in High-Poverty Blocks
EDK is a research lab focused on understanding the physical world at planetary scale. We build systems that organize the world's physical information and make it accessible and usable. Our belief is simple: the physical world should be as searchable and understandable as the digital world.
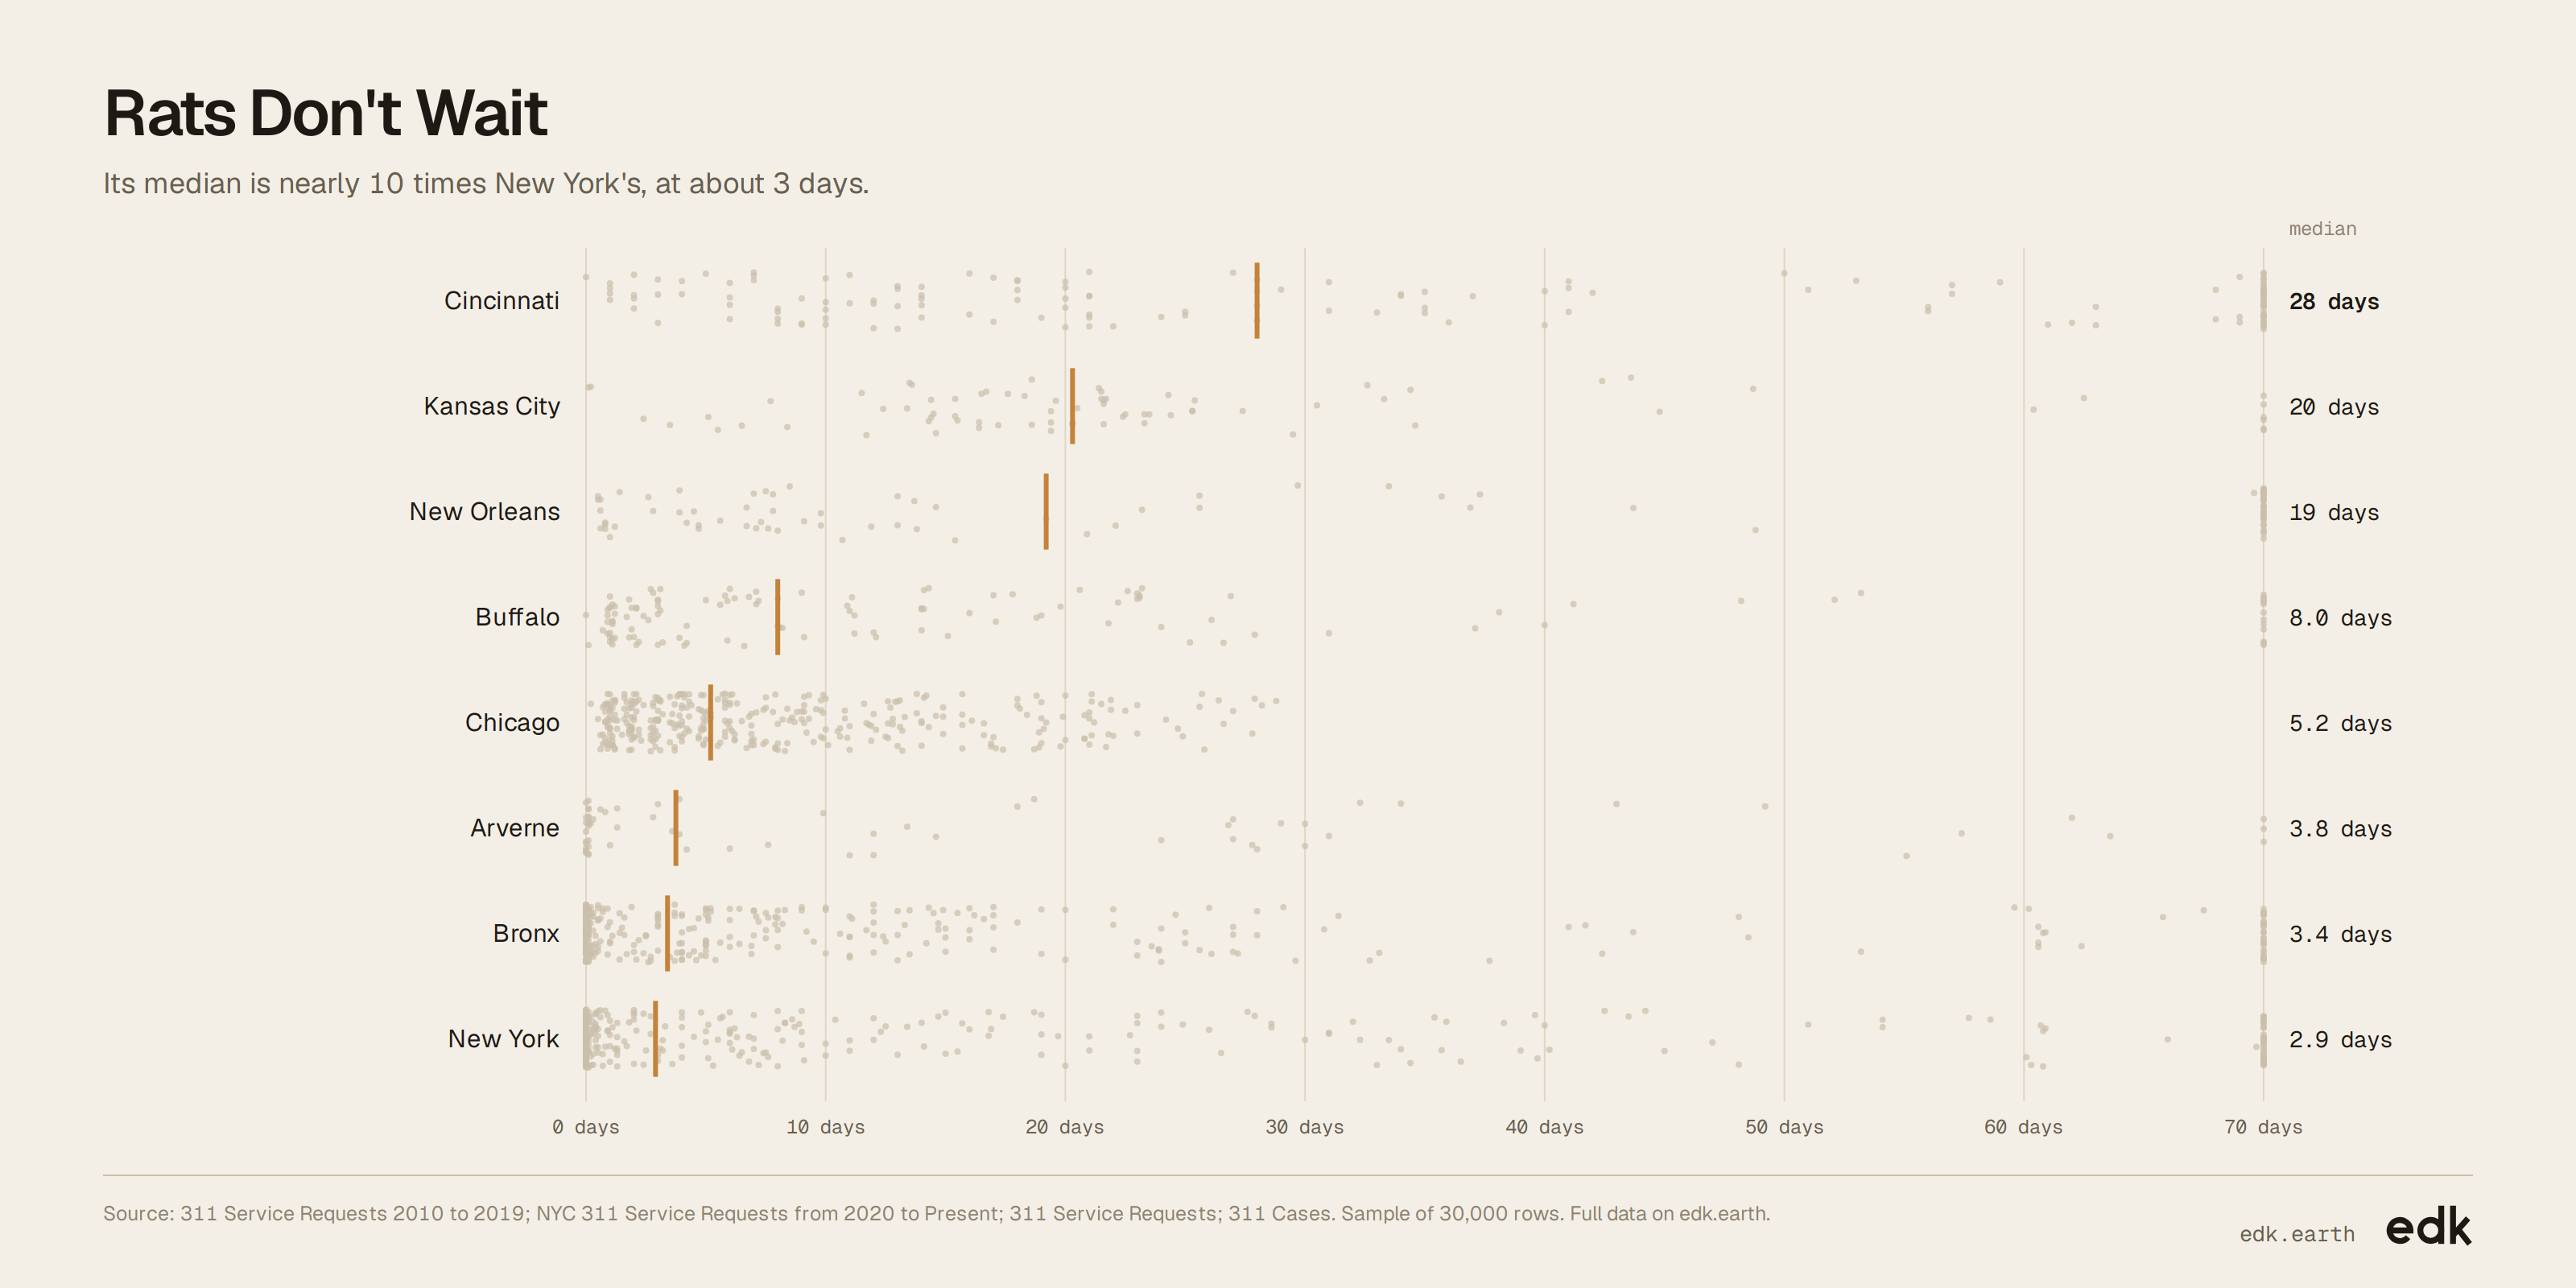
Cincinnati takes 10 times longer than New York to close rat complaints
Compare where rodent complaints arise in high-poverty blocks and how long cities take to close them.
Explore the full data
Every record EDK holds for this dataset. Filter it, then export what you need.
Loading…
Key findings
- Cincinnati's median closure time was 28 days, nearly 10 times New York's 3 days.
- Kansas City's median was 20 days, compared with 3 days in New York.
- Chicago's median was about 5 days, while New York's was about 3.
About this dataset
Each entry is a rodent complaint from a block where at least 30% of residents live below the poverty line, with its filing date, location and status. Together, they map where complaints occur and how closure times vary across places with different poverty and renter shares.
Use it for
- City officials: Compare complaint closure times across neighborhoods and cities.
- Housing researchers: Examine how complaint patterns relate to poverty and renter shares.
- Public health teams: Map rodent complaints in high-poverty neighborhoods.
- Data journalists: Report on differences in complaint response times across places.
Questions to explore
- Where do rodent complaints take longest to close?
- How do closure times vary with neighborhood poverty and renter shares?
- How have complaint locations and closure times changed over time?
Columns
id- Entry number in this extract; unitless.
reported_at- Date and time the complaint was recorded.
days_to_close- Elapsed time from filing to city closure, in days.
closed_at- Date and time the request was closed.
status- Status as published by the source.
poverty_level- Plain-language poverty level for the block group; US only.
poverty_rate_pct- Share of residents below the poverty line, in percent; US only.
renters_pct- Share of homes that are renter-occupied, in percent; US only.
city- City or EDK-matched region name.
latitude- North-south position in decimal degrees, WGS84.
longitude- East-west position in decimal degrees, WGS84.
source- Name of the public dataset containing the complaint.
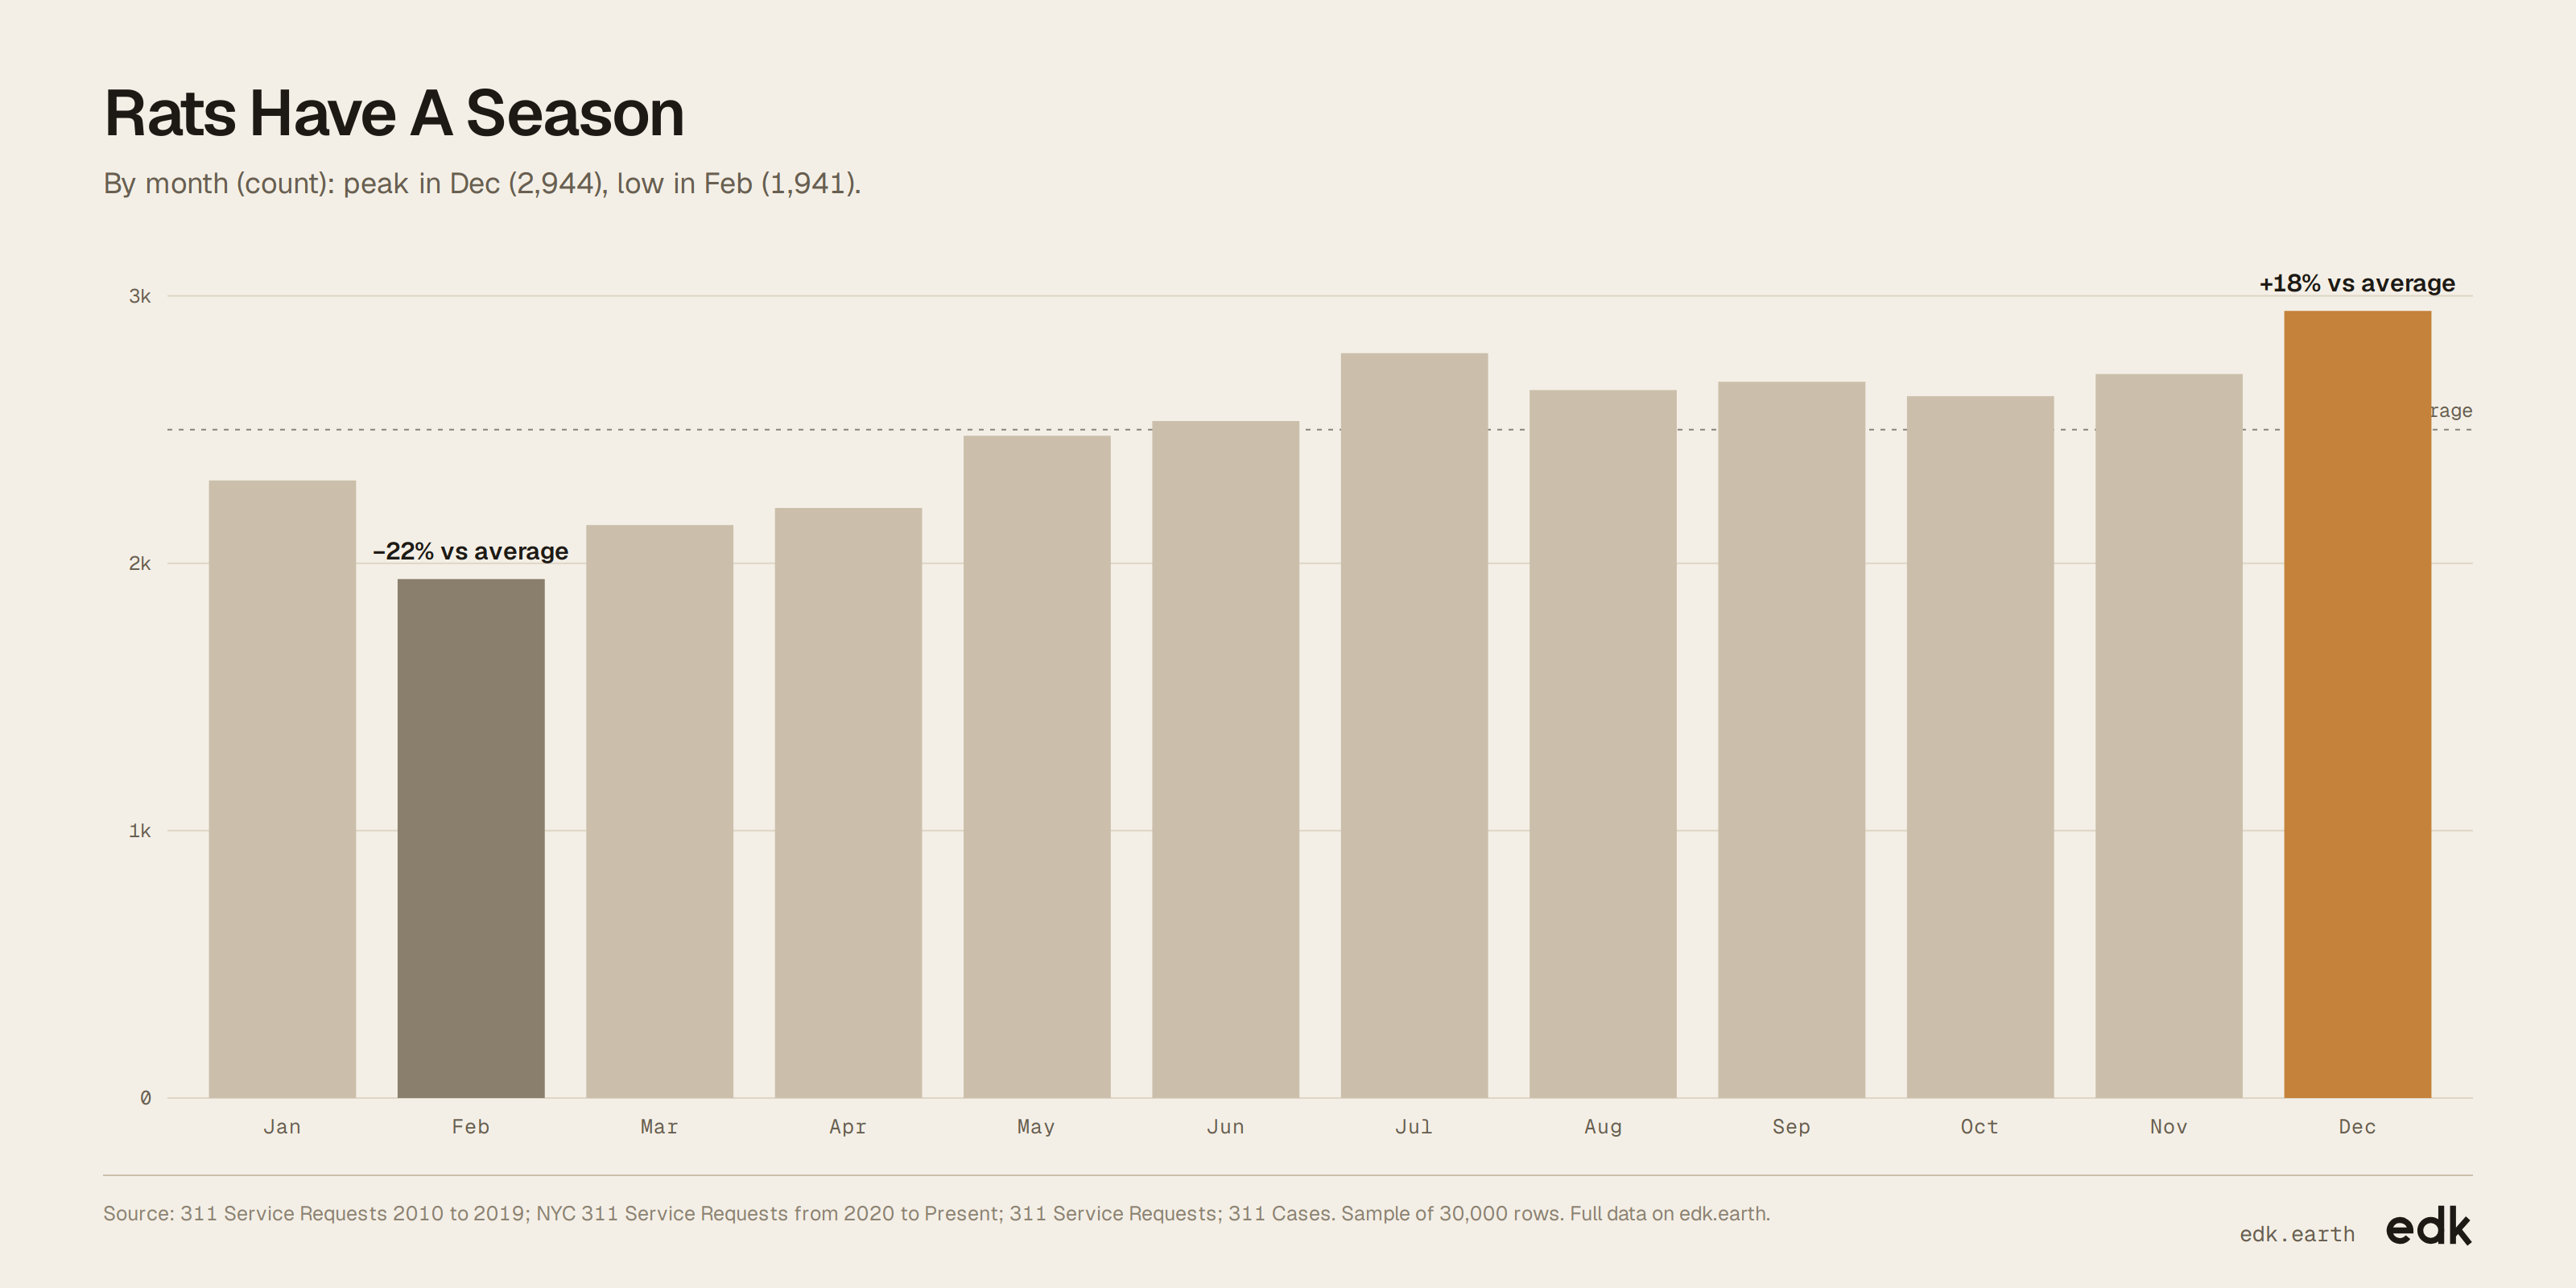
month- Calendar month of filing, from 1 to 12.
Sources
- EDK-1 · EDK
- EDK's spatial model: matches every record to its place and joins the context around it.
- 311 Service Requests 2010 to 2019 · New York City
- Rodent complaint records (See source)
- NYC 311 Service Requests from 2020 to Present · New York
- Rodent complaint records (See source)
- 311 Service Requests · Chicago, IL
- Rodent complaint records (See source)
- 311 Cases · San Francisco, CA
- Rodent complaint records (See source)
- Customer Service Requests · Seattle, WA
- Rodent complaint records (See source)
- New Orleans 311 · New Orleans
- Rodent complaint records (See source)
- Cincinnati 311 · Cincinnati
- Rodent complaint records (See source)
- Pittsburgh 311 · Pittsburgh
- Rodent complaint records (See source)
- 311 Service Requests May 2024 - Present · Buffalo, NY
- Rodent complaint records (See source)
- Kansas City 311 · Kansas City
- Rodent complaint records (See source)
- 311 Service Requests July 2008 - May 2024 · Buffalo, NY
- Rodent complaint records (See source)
- Austin 311 Public Data · Austin, TX
- Rodent complaint records (See source)
- Commonwealth Connect Service Requests · Cambridge, MA
- 17 rows in this sample (See source)
- Get It Done Closed 2026 Cases · San Diego, CA
- 9 rows in this sample (See source)
- Charlotte 311 · Charlotte
- 1 rows in this sample (See source)
Released under CC BY-SA 4.0. Credit "EDK (edk.earth)" and the sources, and share what you build from it under the same license.
Good to know
- Some complaints have no recorded closure time.
- Complaint categories and closure practices may differ by city, limiting direct comparisons.