Parks Under the Worst Air on Earth
EDK is a research lab focused on understanding the physical world at planetary scale. We build systems that organize the world's physical information and make it accessible and usable. Our belief is simple: the physical world should be as searchable and understandable as the digital world.
About 7,000 people live near a typical park with unhealthy air
Find parks where yearly fine-particle pollution reaches at least 25 μg/m³, alongside local climate and nearby population.
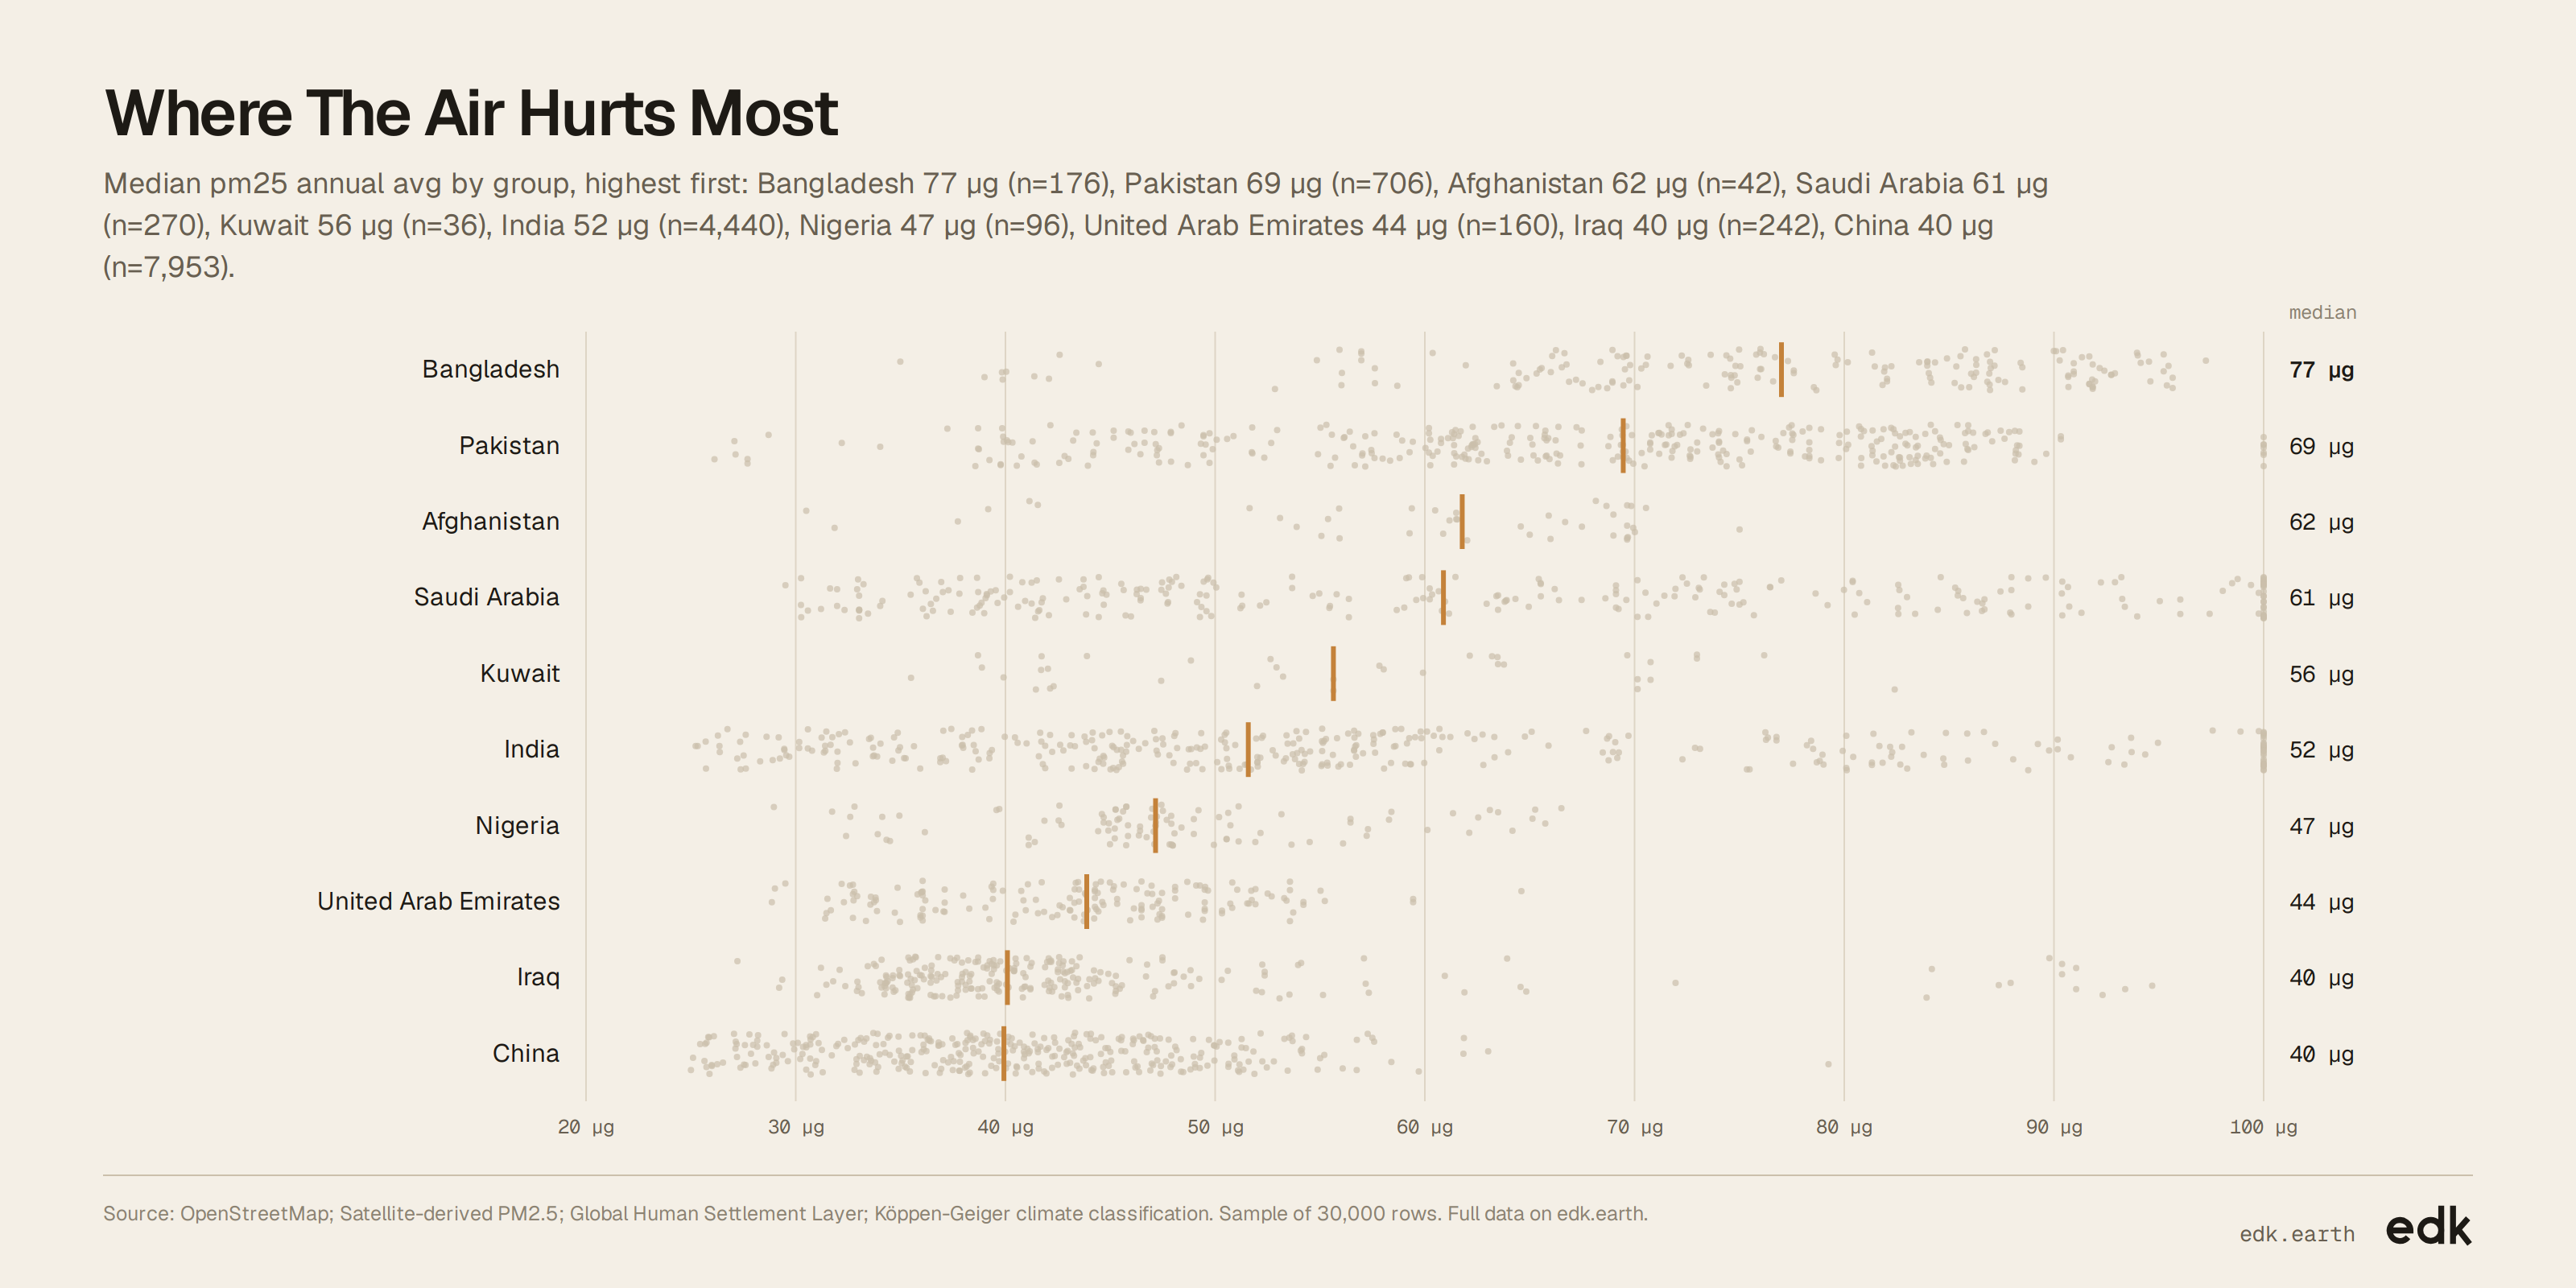
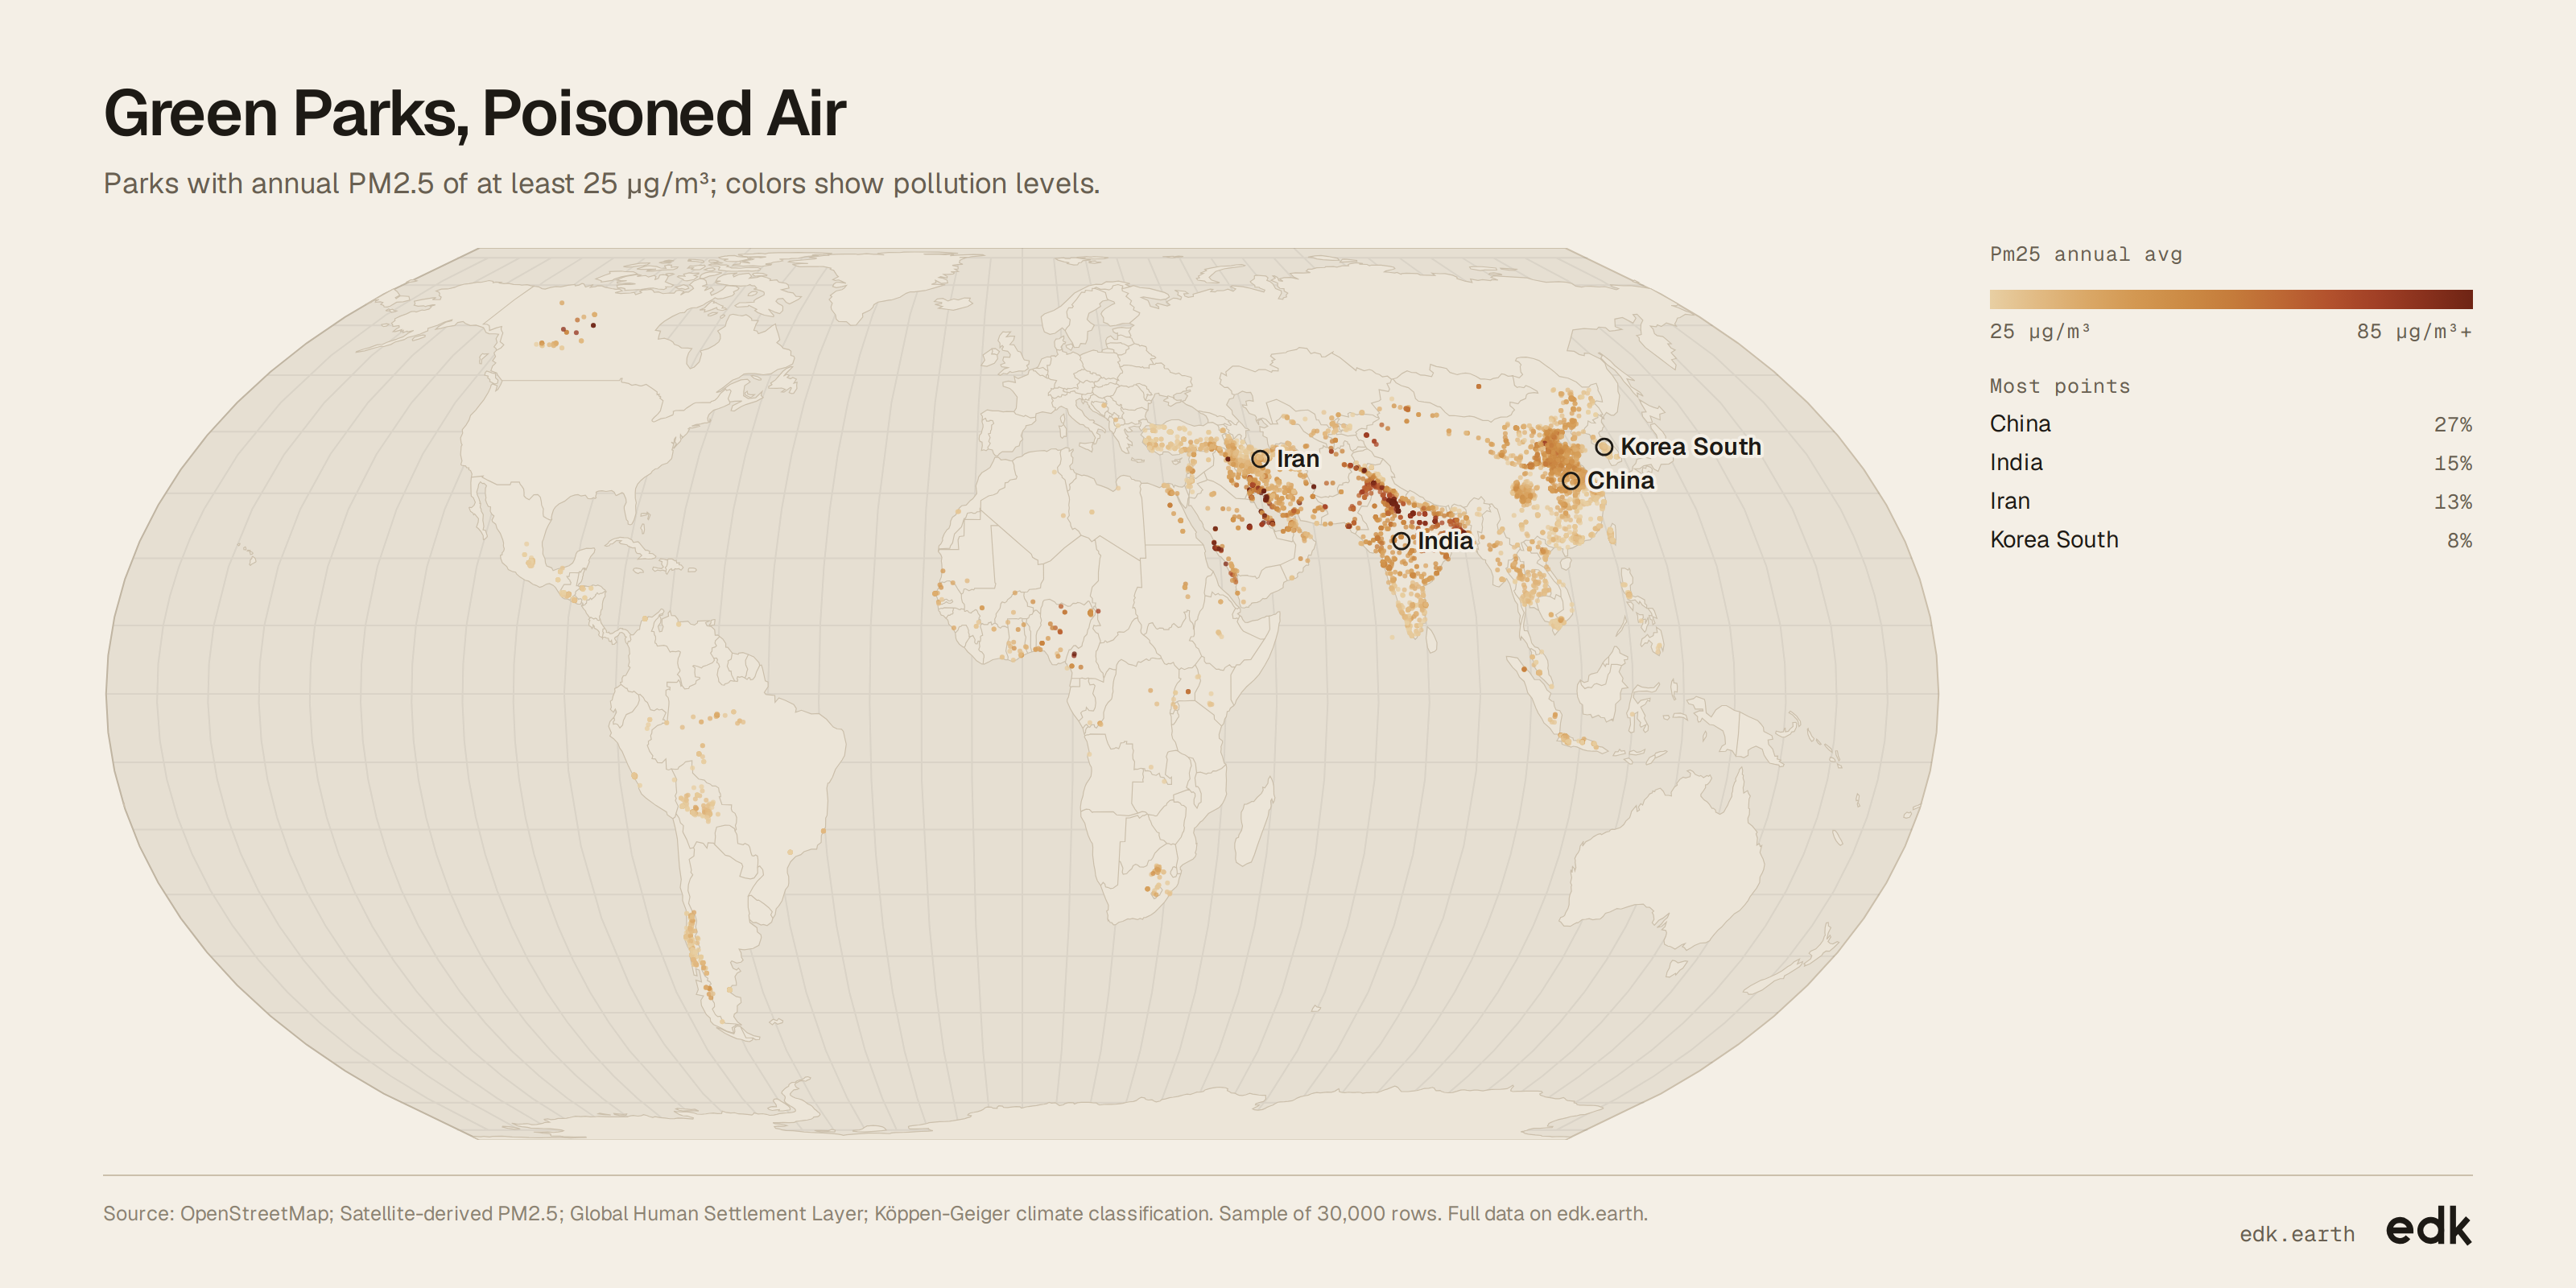
Explore the full data
Every record EDK holds for this dataset. Filter it, then export what you need.
Loading…
Key findings
- The median annual fine-particle level is about 34 μg/m³.
- The highest annual average is about 166 μg/m³.
- The parks span 87 countries.
About this dataset
Each entry names a park, its annual fine-particle pollution, nearby population, climate and location. Together, they show where green space sits amid unhealthy air and how many people live nearby.
Use it for
- Urban planners: Compare parks with pollution levels and nearby population.
- Public health teams: Identify green spaces where people face high annual particle pollution.
- Climate researchers: Compare polluted parks across climate zones.
- Environmental advocates: Map where parks and unhealthy air coincide.
Questions to explore
- Which parks combine the highest pollution with the largest nearby populations?
- How do pollution levels vary across climate zones?
- Where are parks with hazardous air concentrated?
Columns
id- Sequential row number; unitless.
name- Park name as published; text.
air_quality- Plain-language category for annual fine-particle pollution; categorical.
pm25_annual_avg- Yearly average fine-particle pollution; micrograms per cubic metre.
people_within_1km- Estimated people in the surrounding 1 km cell in 2020; people.
climate_zone- Broad climate category; unitless.
country- Country where the park is located; country name.
latitude- North-south coordinate; degrees, WGS84.
longitude- East-west coordinate; degrees, WGS84.
Sources
- EDK-1 · EDK
- EDK's spatial model: matches every record to its place and joins the context around it.
- OpenStreetMap · OpenStreetMap contributors
- Park names and locations (ODbL 1.0)
- Satellite-derived PM2.5 · Atmospheric Composition Analysis Group, WashU
- Annual fine-particle pollution estimates (See publisher)
- Global Human Settlement Layer · European Commission JRC
- Nearby population estimates (See publisher)
- Köppen-Geiger climate classification · Beck et al., Scientific Data
- Climate-zone categories (See publisher)
Released under CC BY-SA 4.0. Credit "EDK (edk.earth)" and the sources, and share what you build from it under the same license.
Good to know
- Only parks with annual PM2.5 of at least 25 μg/m³ are included.
- Nearby population estimates are missing for four parks.