Noise Complaints in Nightlife Districts
EDK is a research lab focused on understanding the physical world at planetary scale. We build systems that organize the world's physical information and make it accessible and usable. Our belief is simple: the physical world should be as searchable and understandable as the digital world.
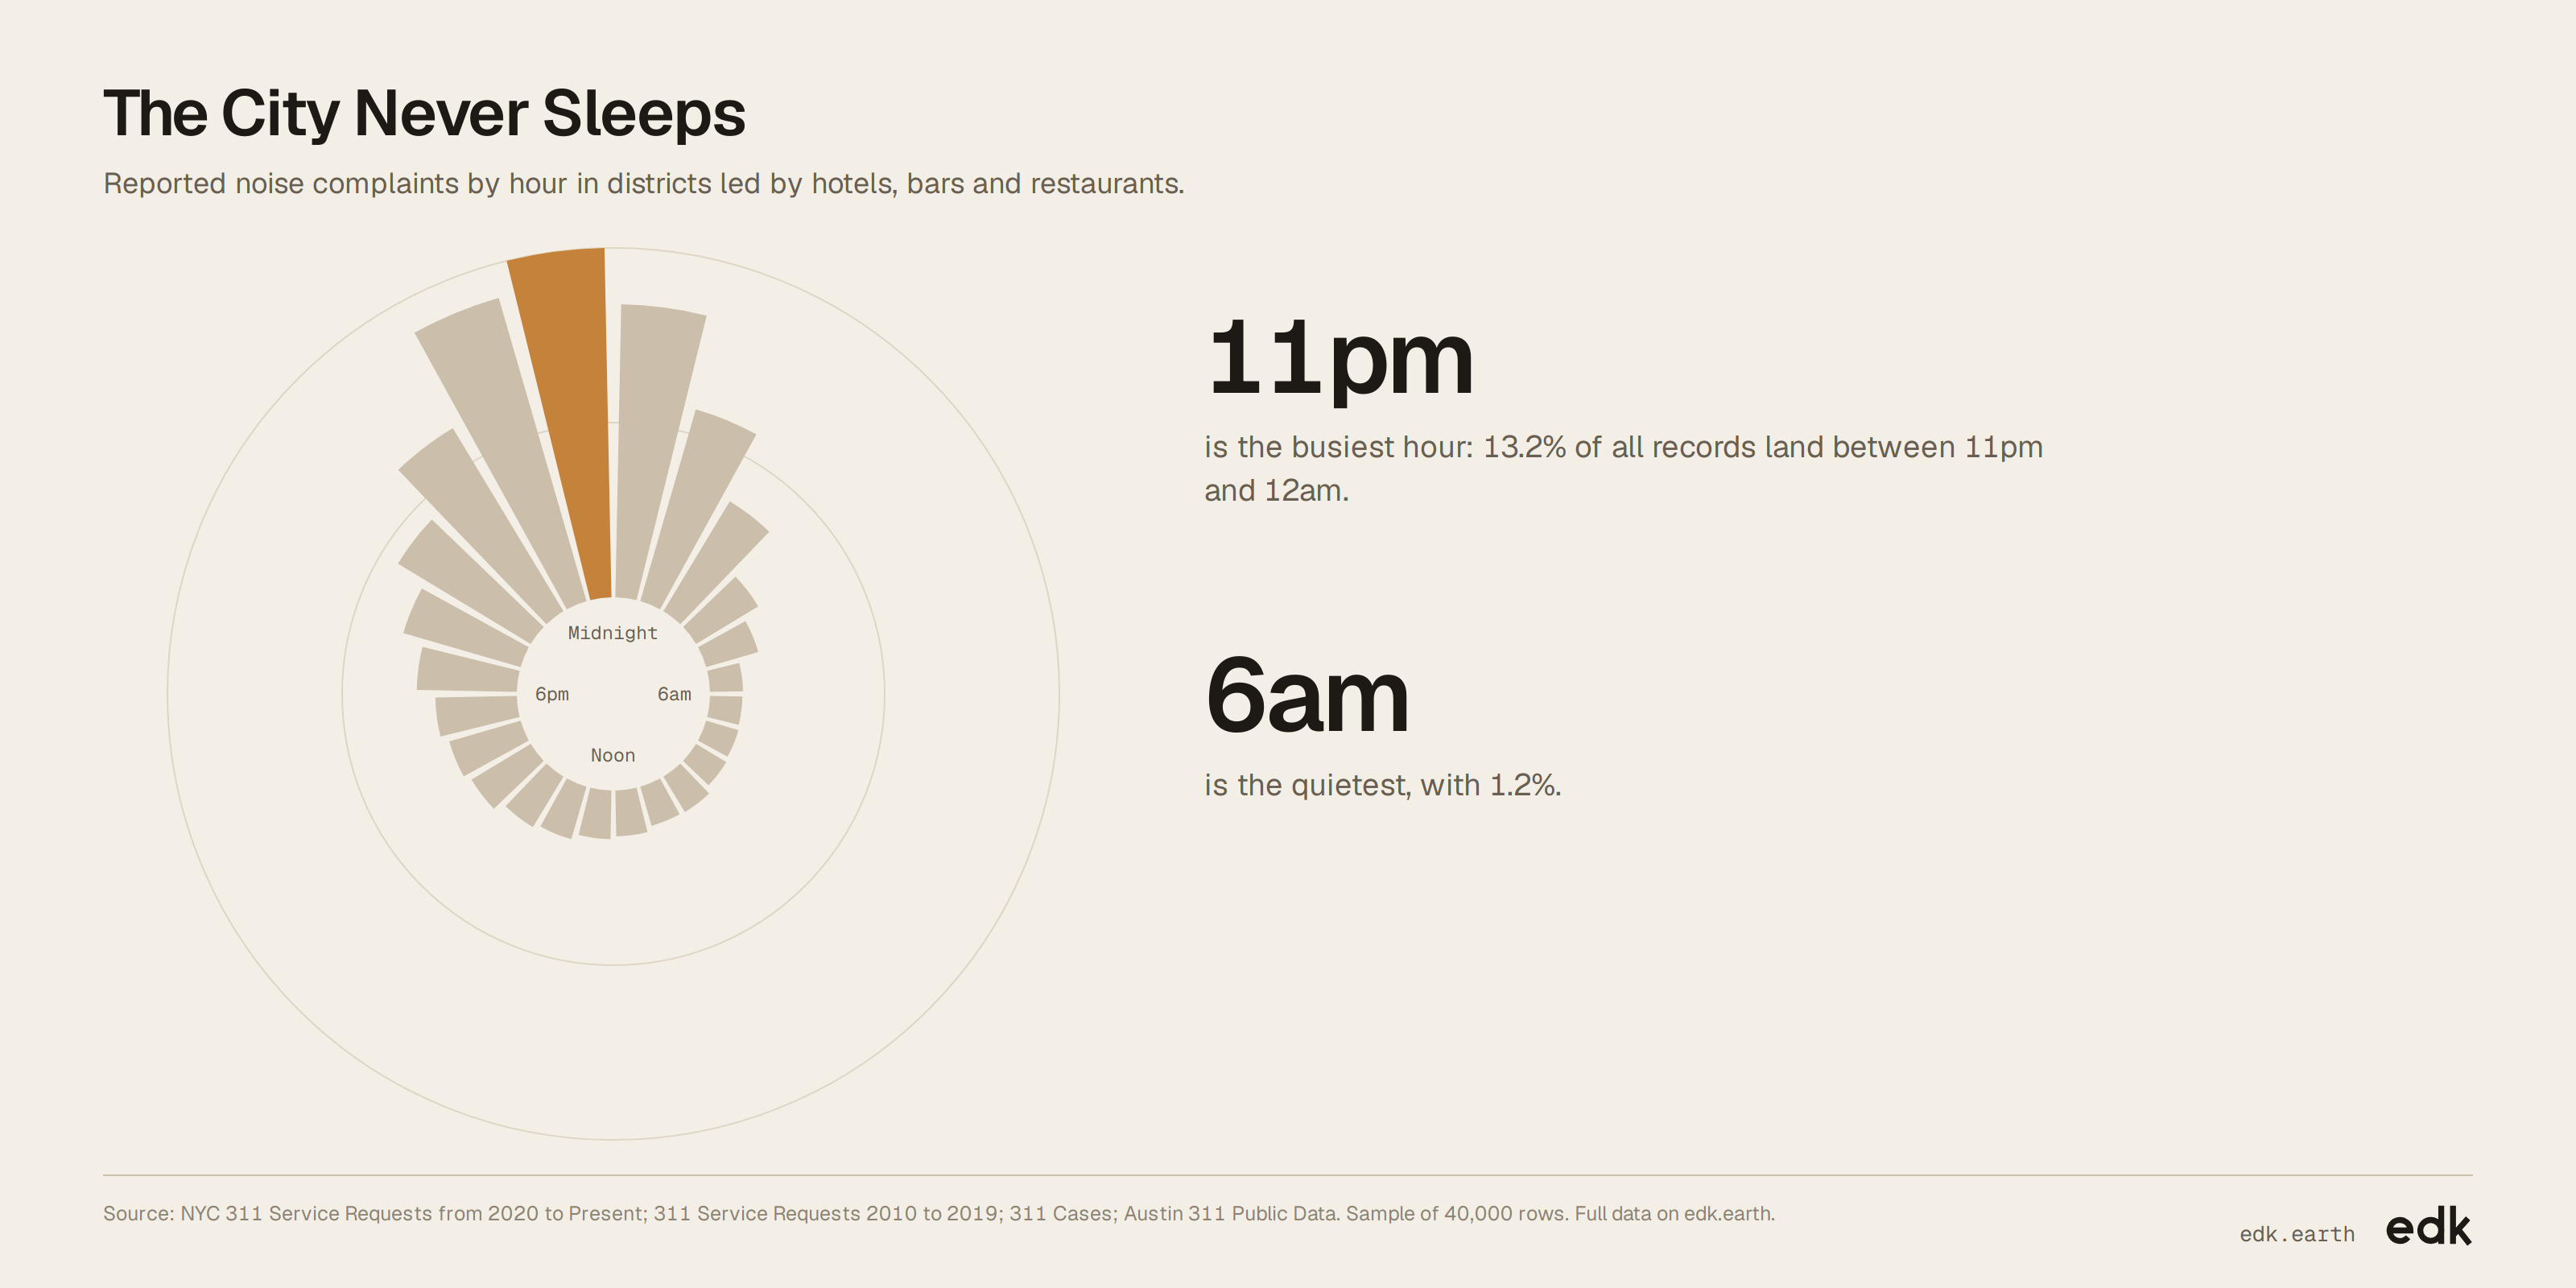
54% of nightlife noise complaints arrive between 10pm and 6am
A time-and-place view of noise complaints in districts led by hotels, bars and restaurants.
Explore the full data
Every record EDK holds for this dataset. Filter it, then export what you need.
Loading…
Key findings
- More than half of complaints arrive between 10pm and 6am.
- 11pm is the busiest hour, accounting for about 13% of complaints.
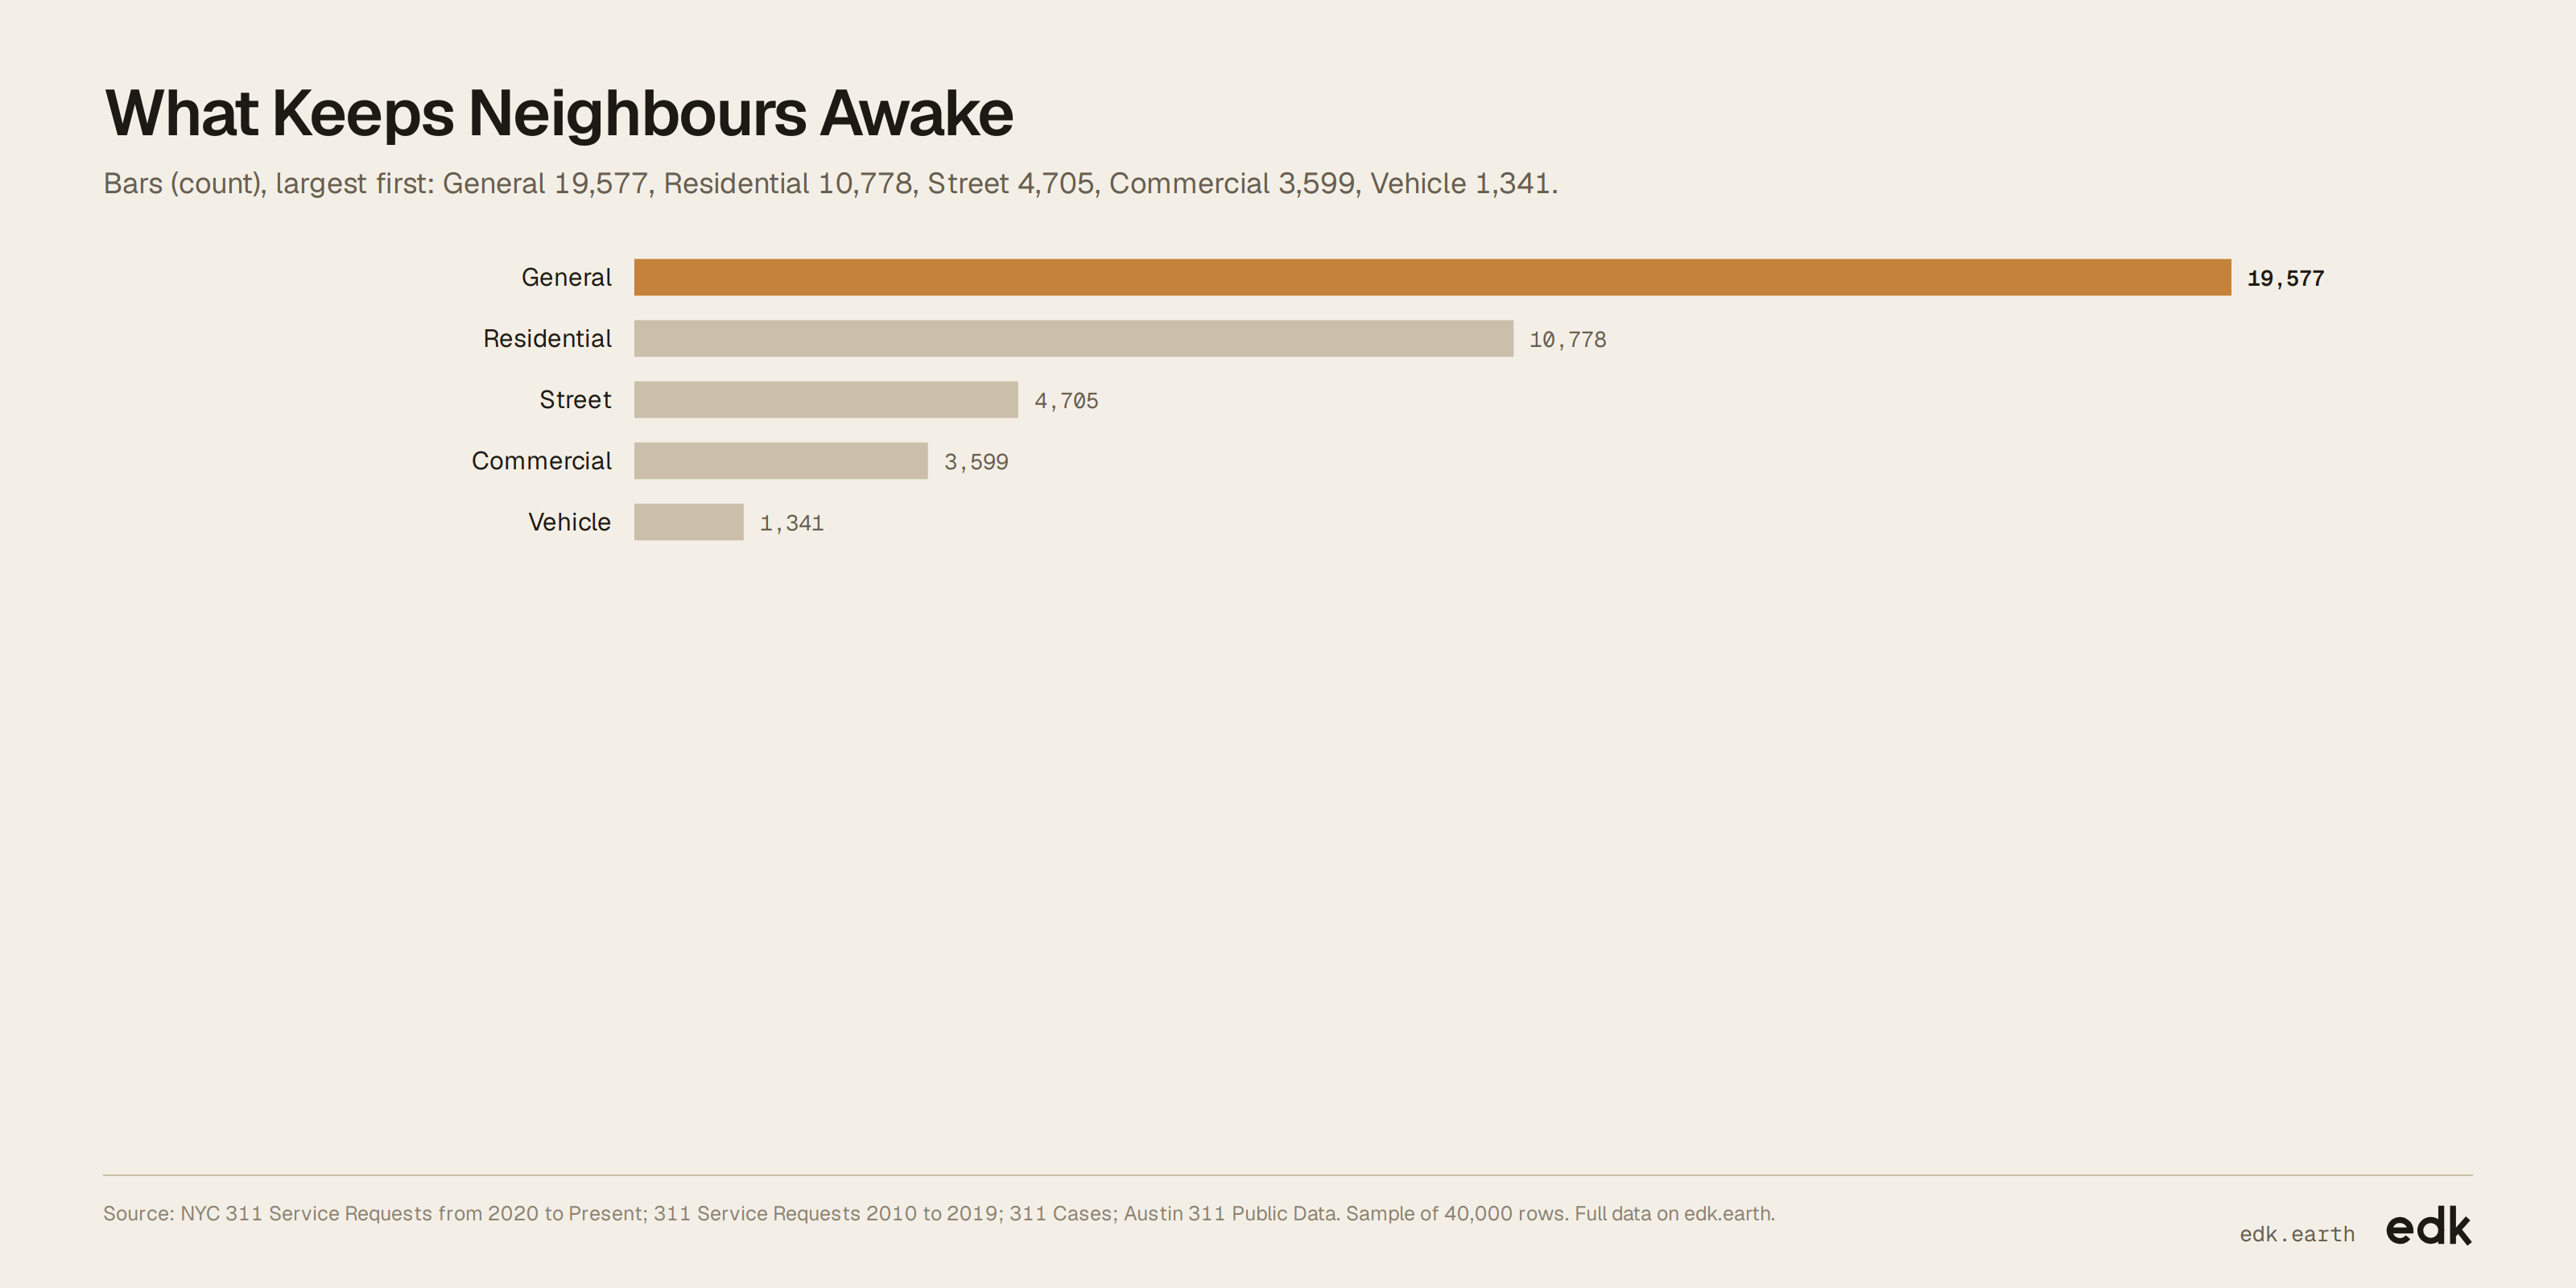
- General noise makes up about half of complaints; residential noise accounts for about one in four.
About this dataset
Each entry is a reported noise complaint in a nightlife district, with its type, time and location. Together, they show when complaints cluster, which kinds dominate and where people call.
Use it for
- City planners: Compare complaint patterns by hour and location.
- Nightlife teams: Identify when and where noise complaints tend to peak.
- Researchers: Study how reported noise varies by type, weekday and city.
- Community groups: Track the timing and location of reported noise in their area.
Questions to explore
- How do complaint patterns change between weekdays and weekends?
- Which kinds of noise are most often reported overnight?
- How do complaint patterns differ across cities?
Columns
id- A sequential identifier assigned to the entry; unitless.
noise_type- The reported category of noise; a type label.
reported_at- The date and time the complaint was reported, as published; timezone may be included.
weekday- The day of the week the complaint was reported.
hour_of_day- The reported hour, from 0 to 23, in local time as published by the source.
status- The complaint status as published by the source.
city- The city or area matched to the location.
latitude- North-south coordinate in WGS84 decimal degrees.
longitude- East-west coordinate in WGS84 decimal degrees.
source- The public service-request dataset the complaint came from.
Sources
- EDK-1 · EDK
- EDK's spatial model: matches every record to its place and joins the context around it.
- NYC 311 Service Requests from 2020 to Present · New York
- New York City service-request records from 2020 onward (See source)
- 311 Service Requests 2010 to 2019 · New York City
- New York City service-request records from 2010 to 2019 (See source)
- 311 Cases · San Francisco, CA
- 311 service-request records (See source)
- Austin 311 Public Data · Austin, TX
- Austin 311 service-request records (See source)
- Dallas 311 · Dallas
- Dallas 311 service-request records (See source)
- New Orleans 311 · New Orleans
- New Orleans 311 service-request records (See source)
- Pittsburgh 311 · Pittsburgh
- Pittsburgh 311 service-request records (See source)
- Kansas City 311 · Kansas City
- Kansas City 311 service-request records (See source)
- Customer Service Requests · Seattle, WA
- Public customer service request records (See source)
- 311 Service Requests May 2024 - Present · Buffalo, NY
- 311 service-request records from May 2024 onward (See source)
- Commonwealth Connect Service Requests · Cambridge, MA
- Commonwealth Connect service-request records (See source)
- 311 Service Requests · Chicago, IL
- 311 service-request records (See source)
Released under CC BY-SA 4.0. Credit "EDK (edk.earth)" and the sources, and share what you build from it under the same license.
Good to know
- Complaints measure what people report, not sound levels measured in the street.
- Most entries come from the New York City area, so city comparisons are uneven.