Left in the Cold: No-Heat Complaints
EDK is a research lab focused on understanding the physical world at planetary scale. We build systems that organize the world's physical information and make it accessible and usable. Our belief is simple: the physical world should be as searchable and understandable as the digital world.
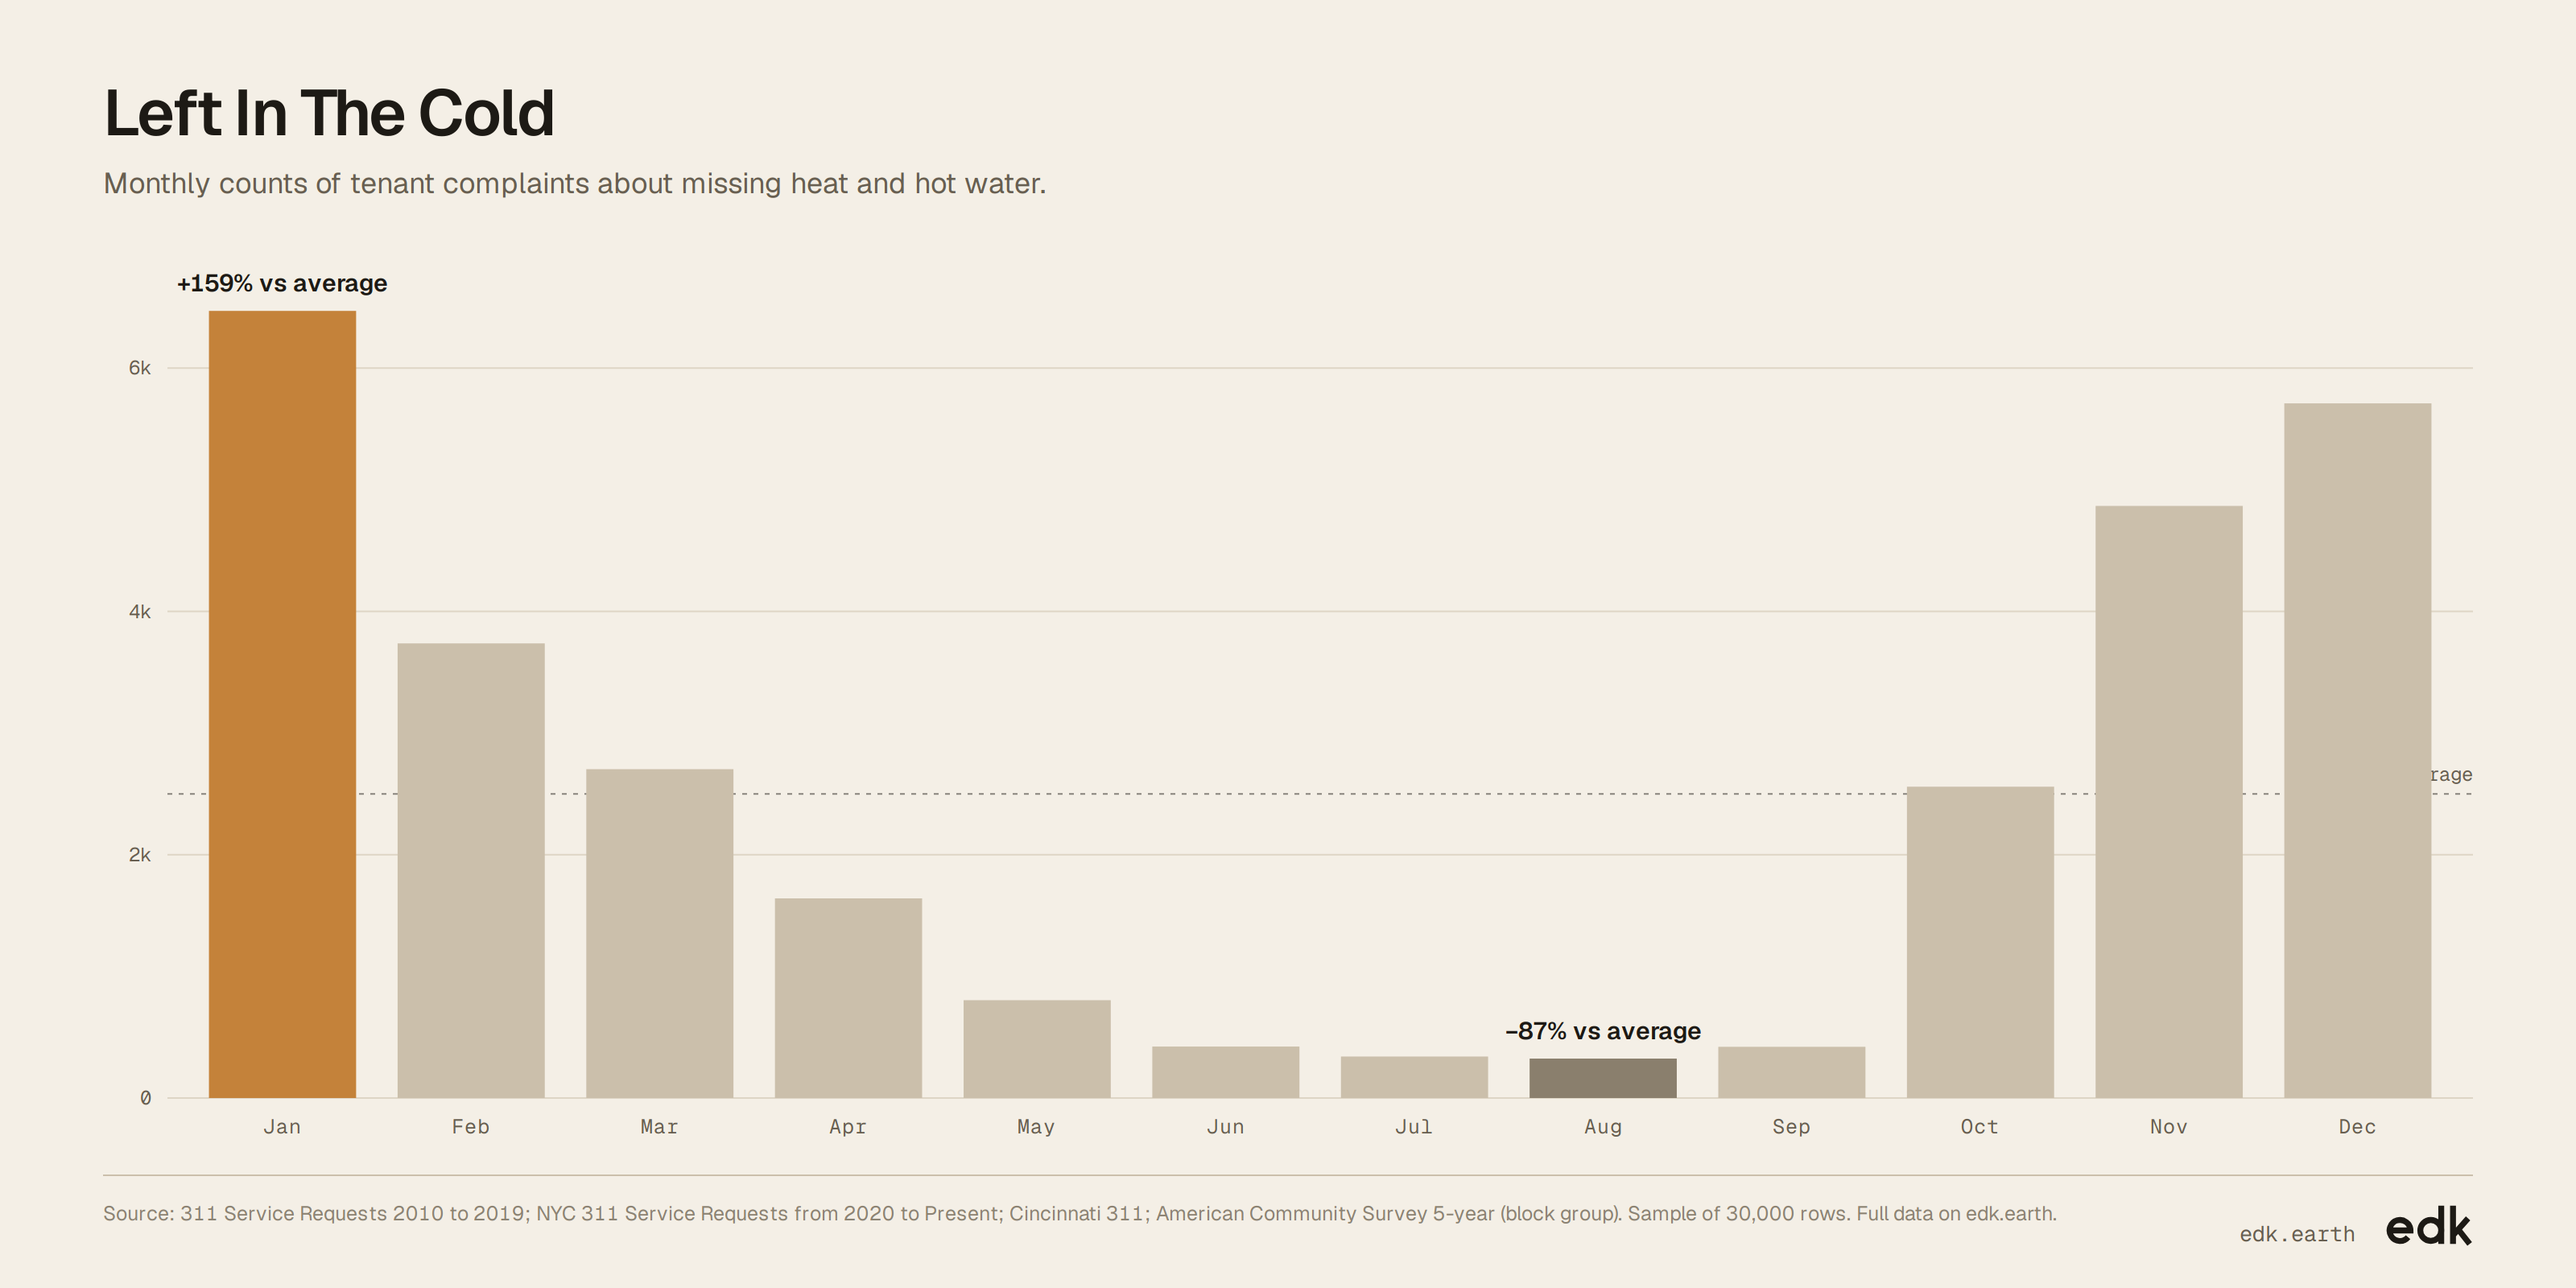
No-heat complaints peak at 6,470 in January
A day-by-day view of heating complaints and housing conditions in low-income neighborhoods.
Explore the full data
Every record EDK holds for this dataset. Filter it, then export what you need.
Loading…
Key findings
- January brings about 6,500 complaints, compared with just over 300 in August.
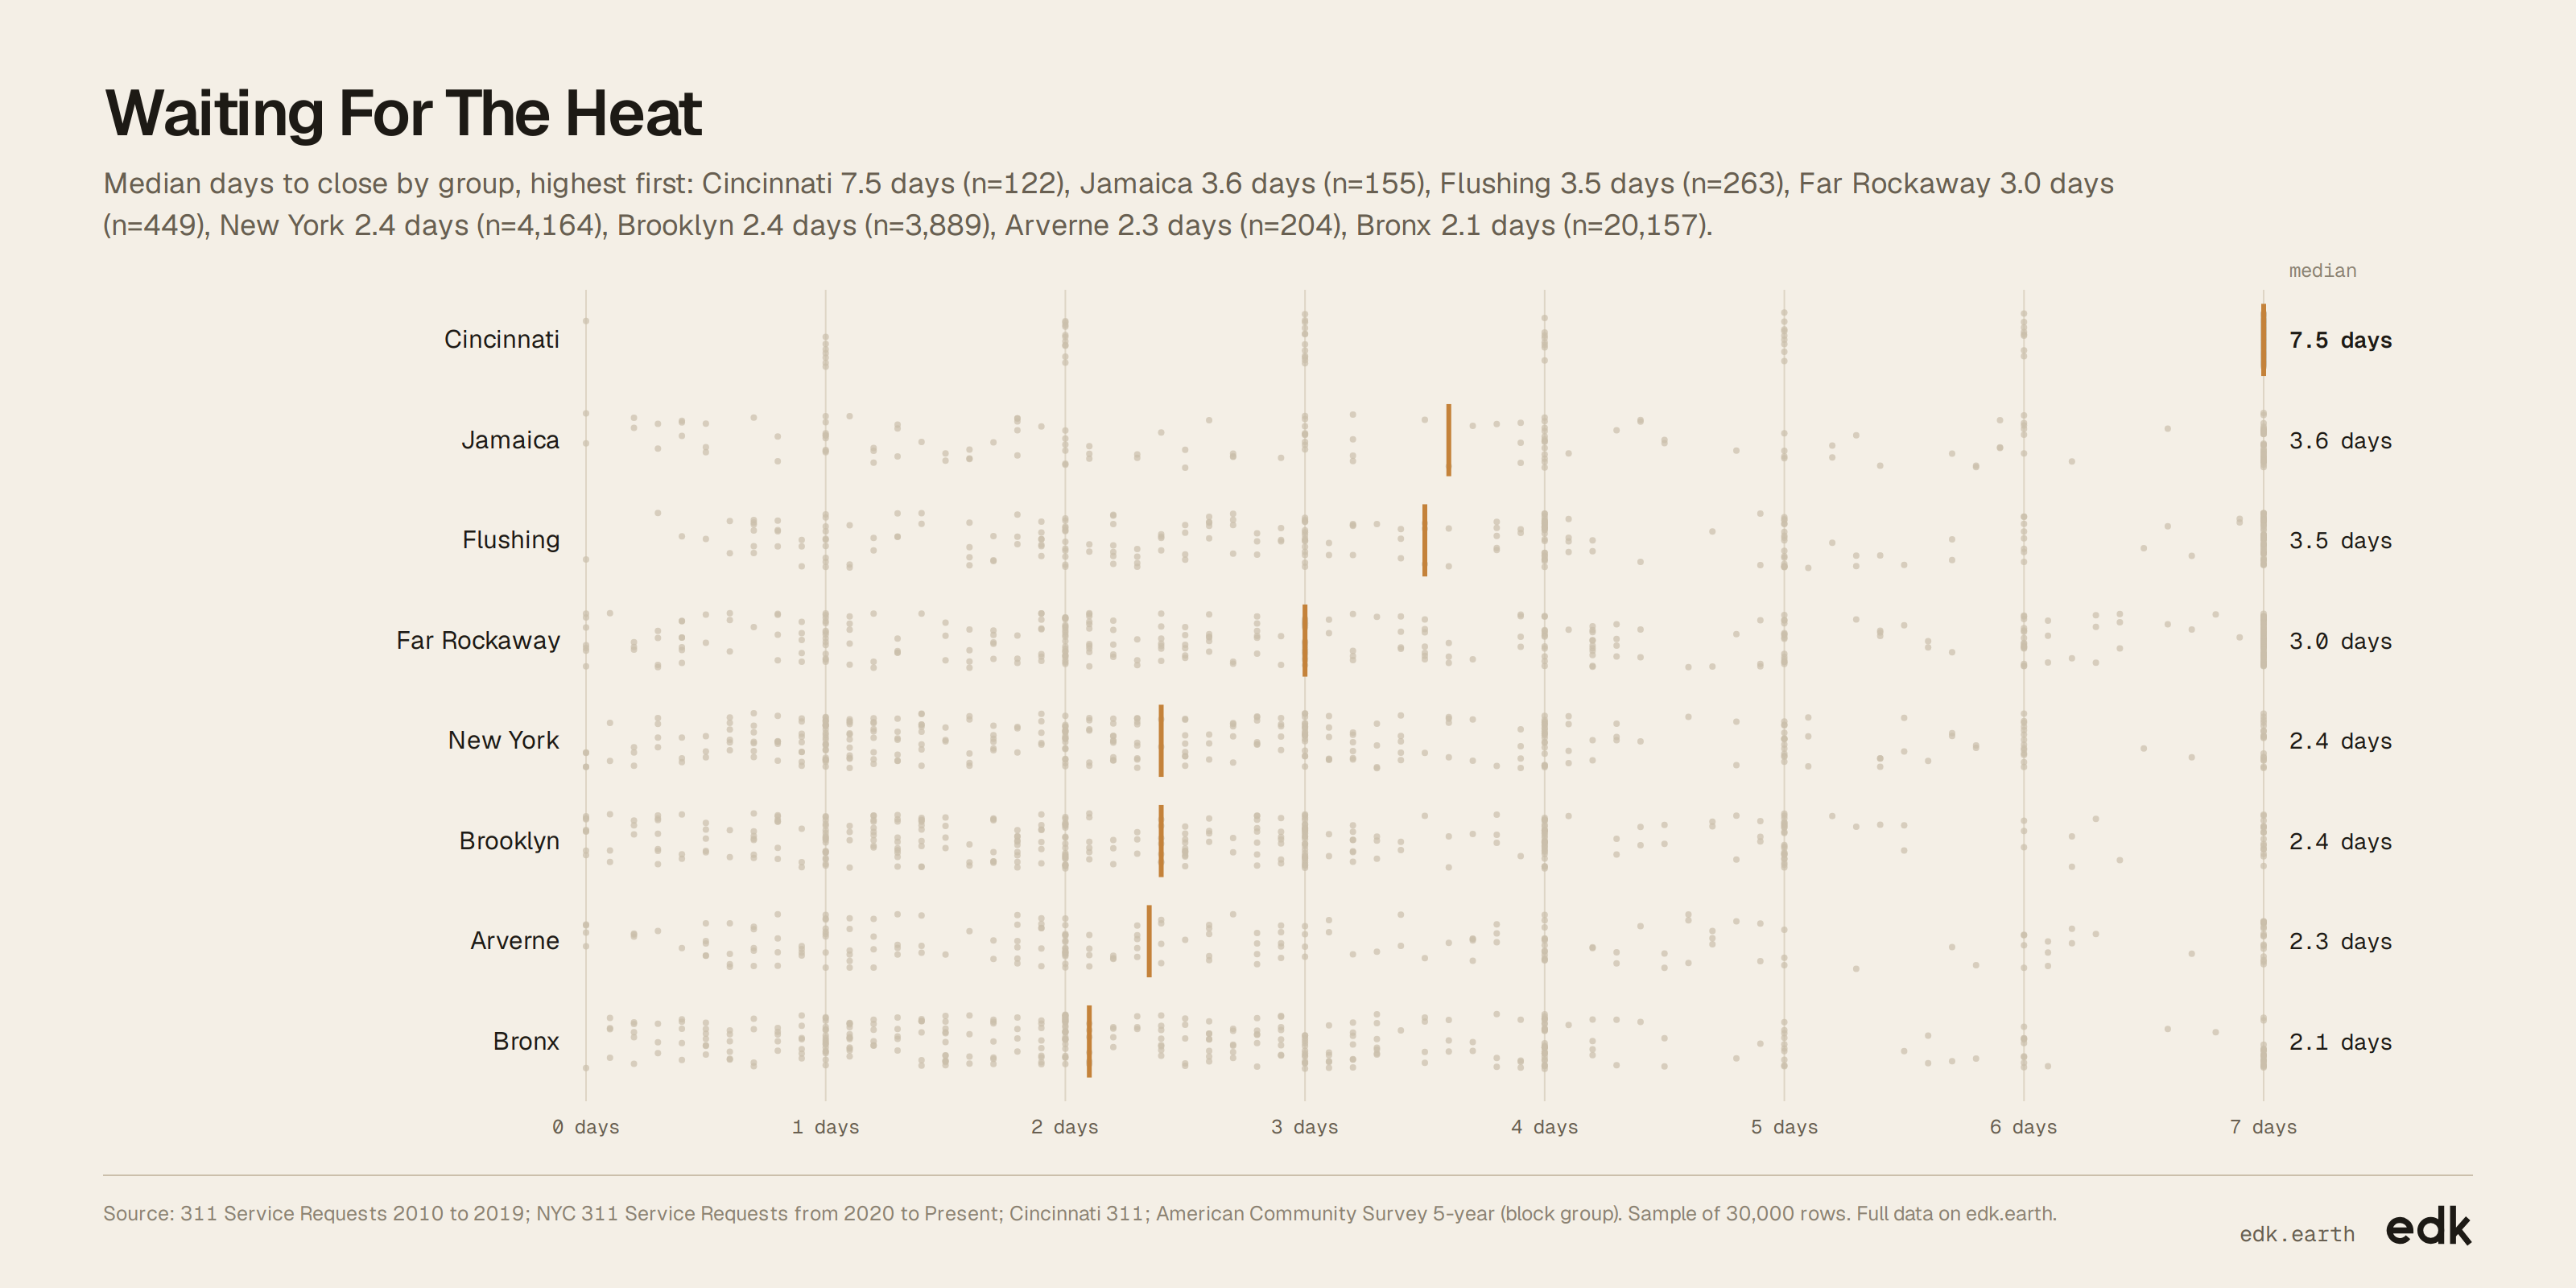
- The typical complaint is closed in about two days.
- The typical block group is about 99% renter-occupied.
About this dataset
Each entry is a tenant complaint about missing heat or hot water, with filing and closure dates and neighborhood housing context. Together, they show when complaints surge and where renters face them amid low incomes and high rents.
Use it for
- Housing advocates: Track when tenants report missing heat or hot water.
- City officials: Review complaint timing and closure delays.
- Journalists: Compare seasonal complaint patterns across neighborhoods.
- Researchers: Study complaints alongside local rent and renter prevalence.
Questions to explore
- How sharply do complaints rise in winter and fall in summer?
- Do complaints take longer to close in areas with more renters?
- How do complaint patterns differ across neighborhoods and years?
Columns
id- Sequential identifier for the record; no unit.
reported_at- Date and time the complaint was recorded, in UTC.
days_to_close- Elapsed time from filing to closure, in days.
closed_at- Date and time the request was closed, in UTC.
income_level- Plain-language income category for the block group; no unit.
median_income_usd- Median household income in the block group, in US dollars.
median_rent_usd- Median gross monthly rent in the block group, in US dollars.
renters_pct- Share of homes that are renter-occupied, as a percentage.
city- City or EDK region matched to the complaint; no unit.
latitude- North-south position in WGS84 decimal degrees.
longitude- East-west position in WGS84 decimal degrees.
source- Name of the public dataset the complaint came from; no unit.
month- Calendar month of the complaint, numbered 1 to 12.
Sources
- EDK-1 · EDK
- EDK's spatial model: matches every record to its place and joins the context around it.
- 311 Service Requests 2010 to 2019 · New York City
- Earlier New York City tenant complaint records (See source)
- NYC 311 Service Requests from 2020 to Present · New York
- Recent New York City tenant complaint records (See source)
- Cincinnati 311 · Cincinnati
- Cincinnati tenant complaint records (See source)
- American Community Survey 5-year (block group) · US Census Bureau
- Block-group income, rent and renter-occupancy measures (See publisher)
Released under CC BY-SA 4.0. Credit "EDK (edk.earth)" and the sources, and share what you build from it under the same license.
Good to know
- Complaints are reports, not a count of every home without heat or hot water.
- Most entries are from the Bronx, so the geographic mix is uneven.